Creating the where I work leaflet map
In this post I’ll describe how I created my “Where I work” map using leaflet and how to include it in the hugo academic theme as an iframe.
N.B. That since writing this tutorial the Stamen.Watercolor provider tile is no longer supported. I have updated the tutorial to include the OpenStreetMap tile.
Loading libraries
To create the interactive map I used the following libraries. Note that the library fontawesome is installed using devtools from github.
#devtools::install_github("rstudio/fontawesome")
library(leaflet)
library(htmltools)
library(fontawesome)
library(htmlwidgets)
Creating the data frame.
I created a work data frame containing details of the latitude and longitude of locations where I’ve worked. I added a column link where I included html links to different parts of my website. The format is: "<b><a href='https://LINK.com'>Link Name</a></b>"
head(work)
##                    location
## 1         Valparaíso, Chile
## 2          Curitiba, Brasil
## 3 Sable Island, Nova Scotia
## 4       Greifswald, Germany
## 5          Arusha, Tanzania
## 6            Kigali, Rwanda
##                                                    institute
## 1                              Instituto de Fomento Pesquero
## 2                             Universidade Federal do Paraná
## 3                                       Dalhousie University
## 4                                Friedrich Loeffler Institut
## 5 Nelson Mandela African Institute of Science and Technology
## 6                    National Institute of Statistics Rwanda
##                    work      lat      lon
## 1 Chilean Pink Cusk Eel -33.0472 -71.6127
## 2            Fox rabies -25.4290 -49.2671
## 3            Grey seals  43.9337 -59.9149
## 4            Fox rabies  54.0865  13.3923
## 5              Teaching  -3.3995  36.7968
## 6              Teaching  -1.9415  30.0574
##                                                                                          link
## 1            <b><a href='http://lauriebaker.rbind.io/#projects'>Chilean Pink-cusk eel</a></b>
## 2 <b><a href='http://lauriebaker.rbind.io/project/internal-project/'>Outfoxing Rabies</a></b>
## 3          <b><a href='http://lauriebaker.rbind.io/#projects'>Grey Seals as Bioprobes</a></b>
## 4 <b><a href='http://lauriebaker.rbind.io/project/internal-project/'>Outfoxing Rabies</a></b>
## 5                        <b><a href='http://lauriebaker.rbind.io/courses/'>R Training</a></b>
## 6                        <b><a href='http://lauriebaker.rbind.io/courses/'>R Training</a></b>
##       icon
## 1     fish
## 2  disease
## 3      gps
## 4  disease
## 5 training
## 6 training
Creating the labels
Next, I created the labels and icons to use on the map. I wanted to include a label including the institute where the work was carried out and also a link to the relevant page on my website. To do this I used the function sprintf() and pointed to the relevant columns in my data institute, link.
There is some additional styling added using <strong> for bold and <br/> to create a break so the the Project information is on the next line.
labels <- sprintf(
  "<strong>%s</strong><br/>Project: %s",
  work$institute, work$link
) %>% lapply(htmltools::HTML)
Creating the icons using awesomeIconList
I wanted to distinguish the different types of projects on the map (using symbols for my projects relating to dish, fish , and gps satellite tracking) and also I wanted to highlight the R training sessions I’ve run. I used different icons from the fontawesome package and used the argument markerColor to distinguish between training sessions and projects.
If you prefer to use the standard marker color you can skip the argument for markerColor as shown for iconset1.
iconset1 <- awesomeIconList(
   fish = makeAwesomeIcon(text = fa("fish")),
   gps = makeAwesomeIcon(text = fa("satellite")),
   disease = makeAwesomeIcon(text = fa("syringe")),
   training = makeAwesomeIcon(text = fa("r-project"))
)

iconset2 <- awesomeIconList(
   fish = makeAwesomeIcon(text = fa("fish"), markerColor = "green"),
   gps = makeAwesomeIcon(text = fa("satellite"), markerColor = "green"),
   disease = makeAwesomeIcon(text = fa("syringe"), markerColor = "green"),
   training = makeAwesomeIcon(text = fa("r-project"), markerColor = "purple")
)
Creating the leaflet map
For the leaflet map I first specified my dataset leaflet(work) and then added the Stamen.Watercolor and Stame.TerrainLabels provider tiles using addProvideTiles.
To explore the different options available you can type providers$ + TAB and scroll through the different layers. The next layer to be added is the markers using addAwesomeMarkers their location is set by the lon and lat columns of the dataset work.
The correct icon is added by specifying the column icon within iconset2[icon]. These match the icons defined so that when the icon is “fish” this is effectively iconset2["fish"] the marker defined as fish is used.
Lastly I specify the popup as my predefined labels, which take the institute and link specified in my dataset.
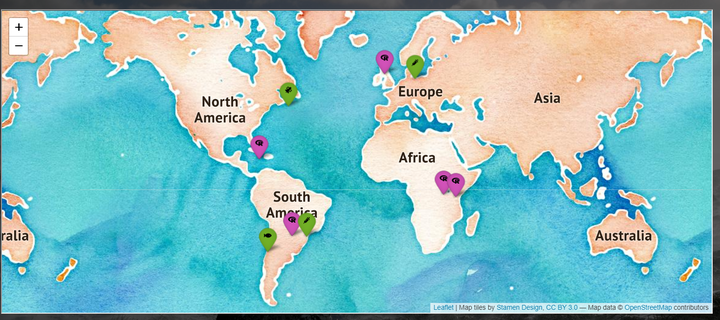
(work_map <- leaflet(work) %>%
              addProviderTiles(providers$OpenStreetMap) %>%
              addAwesomeMarkers(~lon, ~lat, icon = ~iconset2[icon], popup = ~labels))
Figure 1: leaflet map
Getting the leaflet map to render on the website
After you’ve created the leaflet map, you’ll need to save the .html and include it as an iframe. To incorporate this into your website you’ll need to put it in the static folder that comes with the Hugo Academic theme. The first step is to specify the path.
widget_path <- file.path("../../../static/leaflet")

dir.create(widget_path)
The next step is to use htmlwidgets and htmltools to create a widget using save widget.
saveWidget(work_map, file.path(widget_path,"work_map.html"))
When you save the map as a widget it creates the work_map.html file and also creates a folder with all the packages necessary to create the map. When you reference the map as an iframe you will want to reference it from within the “static” folder which contains images and other static features as below. You can specify the size here as well.
<iframe seamless = "" width = "100%" height = "500" class="shortcode-iframe" src="/leaflet/work_map.html"></iframe>
Wish list
Something that I’d like to change is that currently links are opened within the iframe rather than taking users to the relevant part of my website. This ends up creating a vortex of a website within the website. I’d like to change this and also to add an easy way for people to come back to the main map. Any suggestions, send me a DM:-).
Dr. Laurie Baker
Assistant Professor of Mathematics
My research interests include spatial statistics, Bayesian statistics, data science, disease ecology, marine biology, and teaching. Pronouns: She/her/hers.